Automated Cryptocurrency Trading
 About Us
Services
Volume
Quotes
Tutorials, Articles
Contact Us
About Us
Services
Volume
Quotes
Tutorials, Articles
Contact Us


Chart settings - tutorial
1. Intro
The charts that we provide are .html files which are run on most web browsers, under most operating systems, on most computing devices.
We collect information from multiple cryptocurrency exchanges - non-stop 24/7/365 .
Based on this we provide individual charts for major and popular cryptocurrencies. Each chart includes information about 3 items - trade volume, price to buy,
and the spread between buy and sell price.

A chart for a single currency is for a specific period of time (for ex. 6hrs,1day,7day...), and is composed by samples taken regularly (for ex. every 10s,1min,5mins...).
The file names reflect the time period - for example vps6hBTC.htm is a chart for 6 hours time span. (see 'Charts services - details' in References)
A chart for a single currency comes in 2 types - absolute values (in USD) and normalized values (in %). The file names show which type is the specific file.
For example vps6hBTC.htm is an absolute value chart, and vps6hBTCn.htm is a normalized value chart.
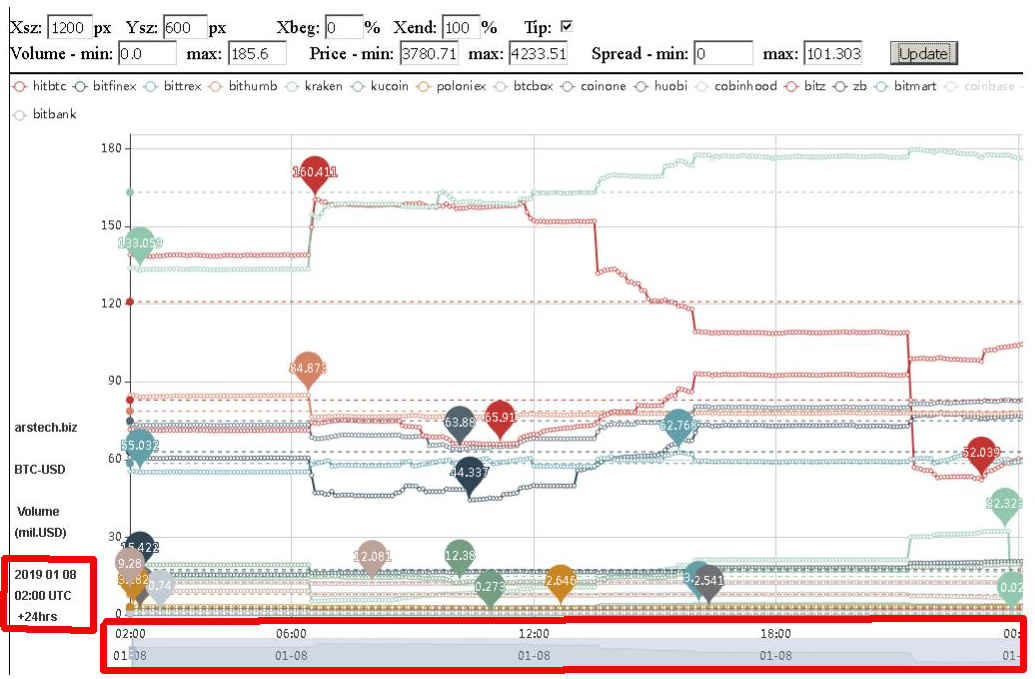
The chart is composed in 4 sections - on the top there is the 'control panel' section, and then 1 section for 'volume' , 'price' and 'spread'.
The price listed in the charts is in USD. While some of the crypto exchanges we collect information from use different fiat currency -
CAD / EUR / KRW / JPY, their pricing is recalculated to USD.
There may be slight difference between the current exchange rate and the rate used for creating of the charts, however the charts accurately
reflect the movement of the cryptocurrency.
The number of exchanges listed in a chart for a specific symbol may be lower that the number of exchanges, which carry the specific symbol,
that we collect information from.
We collect information about the top 10 cryto-to-fiat symbols by volume on each exchange. This represents anywhere from 60 to 90% oe more of the
total trade volume of an exchange.
The reason for a cryptoexchange not listed in the charts is that the specific symbol is outside of the top 10 traded symbols, by volume
on this exchange.
2. UTC to local time
Users of the charts can be located worldwide.
The charts are generated in UTC time - as shown in the title and on the horizontal - X axis .
To adjust to local timezone you will need to add or subtract number of hours from the time of the specific UTC sample.
For example:
Pacific Standard Time PST = UTC - 8hours
Pacific Daylight Time PDT = UTC - 7hours
Central European Time CET = UTC + 1hours
Central European Summer Time CEST = UTC + 2hours
3. Adjusting to screen size
Viewing of the charts can be done on computing devices - laptops and tablets with different screen sizes.
We recommend to use a device with high screen resolution to get all 3 sections - volume, price, and spread of the charts in a single screen
without scrolling up or down.
The default resolution of a single section is - width=1200pixels, and height=600pixels.
The total size of all 3 sections is - 1200 X 1800 (3*600)pixels .
The first 2 items of the 'control panel' section contain 2 edit fields with the same corresponding initial values -
Xsz: 1200 px , Ysz: 600 px

To change the size of every of the 3 chart sections enter new values, for ex. Xsz: 1300 px , Ysz: 300 px ,then push 'Update' button. The total
new size of all 3 sections will be - 1300 X 900 (3*300)pixels .
4. Disabling and re-enabling of exchanges
Every exchange in the volume/price/spread charts is shown as a line with a certain color.
Additionally for every exchange there is a dashed line ' - - - - ->' showing the average number, and 2 balloons with the maximum and minimum
value for the time period on the horizontal axis.

The top part of a chart shows a list of the exchanges in the chart.
To disable an exchange click on the colored '-O-' symbol in front of the name of the exchange. This will remove the line for the exchange,
and the average line, and the balloons with min and max values.
To re-enable a disabled exchange click again on the '-O-' symbol in front of the name of the exchange.
5. Adjusting time period
When volume/price/spread charts are loaded the time period shown is 24 hours, composed by samples taken every 5 minutes.
The 'control panel' on the top side has a section which controls the time period on the horizontal (X) axis of the chart. Initially it is
set to - Xbeg: 0% , Xend: 100%
To see things in greater details in time, for example in the middle 1/3 of the 24hours period put values as -
Xbeg: 33% , Xend: 66% and then push 'Update' button.

The horizontal axis on all 3 charts - volume/price/spread will stretch left and right to show the middle 8 hours between the begin and end
side. Updating Xbeg and Xend aligns all 3 charts are on the horizontal axis.
Additionally the bottom part of each chart has a slider which initially covers 100% of the bottom, and when changed to for ex. 33-66% will
shrink to 1/3 size, and move to the middle.
You, the user, can manually shrink or stretch the time using the time slider on one chart, but this will mis-align the time scale and
period of this chart with the other 2 charts.
To re-align the horizontal/X/time axis , enter Xbeg: , Xend: values and then push 'Update' button.
6. Mouse tip options
Moving the mouse cursor over the charts reveals information in the form of a rectangular window with data.
The 'control panel' on the top side has the Tip checkbox which controls which one is shown of the 2 ways of presenting information
to the user.
By default Tip is checked and moving the mouse cursor will show a vertical line and a rectangular window with - UTC time on the top, then
a line each with the name of all exchanges and the values for the volume/price/spread in the specific time.
When Tip is unchecked, moving the mouse cursor on a point of a line of an exchange will show a rectangular window with - the name of this
exchange and the value for the volume/price/spread in specific time for this exchange.

To change the way of presenting information to the user, do a check or uncheck of Tip and then push 'Update' button.
7. Absolute values vs. Normalized values
Every crypto symbol generates 2 types of charts - absolute values and normalized values.
The absolute values chart is the normal chart which reflects the quoted values on exchanges.
The normalized values chart takes the absolute values of volume/price/spread and recalculates them in percentages.
The volume is calculated based on lowest value for the time period - set as 100%. Then the highest value comes on the top/above 100%. For example -
Exchange1 has minimum volume value of $10mil USD and maximum value of $12mil USD for the time period.
The normalized numbers for exchange1 is - minimum of 100% and maximum of 120%.
Exchange2 has minimum volume value of $50mil USD and maximum value of $55mil USD for the time period.
The normalized numbers for exchange2 is - minimum of 100% and maximum of 110%.
The price is calculated based on lowest value for the time period - set as 0%. Then the highest value comes on the top/above 0% and represents
actually the gain in value. For example -
Exchange1 has minimum price value of $1000 USD and maximum value of $1200 USD for the time period.
The normalized numbers for exchange1 is - minimum of 0% and maximum of 20%.
Exchange2 has minimum price value of $500 USD and maximum value of $550 USD for the time period.
The normalized numbers for exchange2 is - minimum of 0% and maximum of 10%.
The spread is calculated based on lowest value for the time period - set as 0%. Then the highest value comes on the top/above 0%.
Usually the amount of gain gain is reduced by the amount of spread (either absolute or normalized). For example -
Exchange1 has sell price value of $1000 USD and buy price of $1050 USD for the time period - spread of $50.
The normalized numbers for exchange1 is - minimum of 0% and maximum of 5% ($50/$1000).
Exchange2 has sell price value of $500 USD and buy value of $510 USD for the time period - spread of $10.
The normalized numbers for exchange2 is - minimum of 0% and maximum of 2% ($10/$500).
8. Adjusting the volume
The 'control panel' on the top side has a section which controls the volume values on the vertical (Y) axis of the volume chart - Volume min and max.
For absolute values, initially it is set to for example - Volume min: 0 , max: 138.0 , where 138.0 is - USD $138 millions
For normalized values, initially it is set to for example - Volume min: 100 , max: 1115 , where 100 - 115 is - 100% to 115%
The initial max value set for volume is based on the highest value of all exchanges for the 24hr time period plus 1-3% .
To get a sub-section of the absolute volume values, for ex. from USD $10 million to USD $75 million enter - Volume min: 10 , max: 75
To get a sub-section of the normalized volume values, for ex. from 105% to 110% enter - Volume min: 100 , max: 110
Then push 'Update' button.

This will update the view of the volume section, without changing the other sections. All 3 charts will still remain aligned on the
horizontal axis.
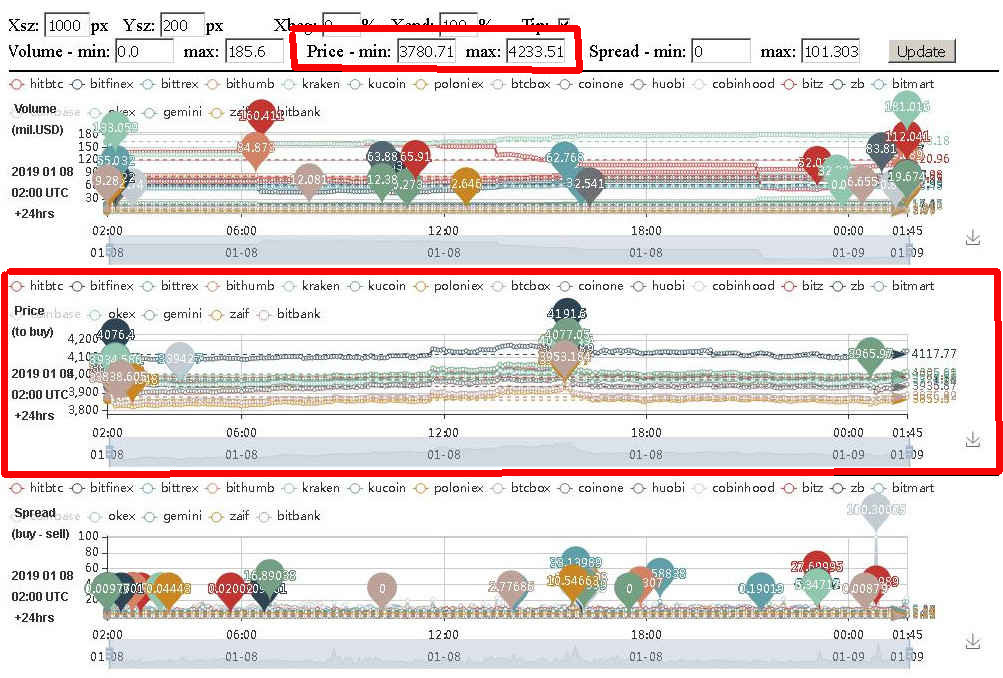
9. Adjusting the price
The 'control panel' on the top side has a section which controls the price values on the vertical (Y) axis of the price chart - Price min and max.
For absolute values, initially it is set to for example - Price min: 1000 , max: 1045 , where the min and max values are in - USD.
For normalized values, initially it is set to for example for BTC - Price min: 0 , max: 4.5 , or min = 0% , max = 4.5%
The initial min and max values set for price are based on the highest value of all exchanges for the 24hr time period plus 1-3%
and on the lowest value of all exchanges for the 24hr time period minus 1-3% .
There maybe no need to adjust the price.
Still, to get a sub-section of the absolute price values, for ex. from USD $1010 to USD $1040 enter - Price min: 1010 , max: 1040
To get a sub-section of the normalized price values, for ex. from 1% to 4% enter - Price min: 1 , max: 4
Then push 'Update' button.
This will update the view of the price section, without changing the other sections. All 3 charts will still remain aligned on the
horizontal axis.
10. Adjusting the spread
The 'control panel' on the top side has a section which controls the spread values on the vertical (Y) axis of the spread chart - Spread min and max.
For absolute values, initially it is set to for example - Spread min: 0 , max: 101.7 , where 101.7 is - USD $101.7
For normalized values, initially it is set to for example - Spread min: 0 , max: 3.5 , where 3.5 is - 3.5%
The initial max value set for spread is based on the highest value of all exchanges for the 24hr time period plus 1-3% .
To get a sub-section of the absolute spread values, for ex. from USD $5 to USD $45 enter - Spread min: 5 , max: 45
To get a sub-section of the normalized spread values, for ex. 1.2% to 2.6% enter - Spread min: 1.2 , max: 2.6
Then push 'Update' button.

This will update the view of the spread section, without changing the other sections. All 3 charts will still remain aligned
on the horizontal axis.
11.Save as image
On the bottom right side of each of the 3 sections - volume/price/spread there is an icon which allows saving of the current
view of a section as image.

The current image format to 'save as' is - PNG / .png .
References:
Charts services details -
time spans, update period, sample time, files delivered, ways of delivery
bar chart - 24hours cumulative volume of cryptocurrency exchanges that we collect information from

text file -
24hours detailed volume on cryptocurrency exchanges that we collect information from