Automated Cryptocurrency & Foreign Exchange Trading
 About Us
Tutorials, Articles
Q & A
Contact Us
About Us
Tutorials, Articles
Q & A
Contact Us

Volatility charts - Foreign Exchange
Download :
fx-vol-chrtd - demo version ||| free
and fx-vol-chrt - standard (live) version ||| US$49 / month
Before running the program: Register for the use.
After registration the user of the standard (live) version has to
Login & select product and submit payment information.


1. Basics
Foreign Exchange is a financial market composed of several categories including - currencies, metals, commodities, indexes, bonds.
The Volatility charts program receives information from a real time data collection system, analyzes the information and selects the items with the
highest volatility for a period of time.
Volatility is the frequent change from low to high - it can be considered either as a friend or as an enemy of the trader. Used in the right way
volatility allows the trader to make the highest gains with the lowest leverage.
2. Features
The ForEx Volatility charts are delivered by a program running on 3 desktop platforms:
- Windows - runs on Windows 7 and later
- Mac OS X - runs on OS X 10.11 and later
- Linux - runs on 64bit Ubuntu 18.04 (or 2018 distro release) and later
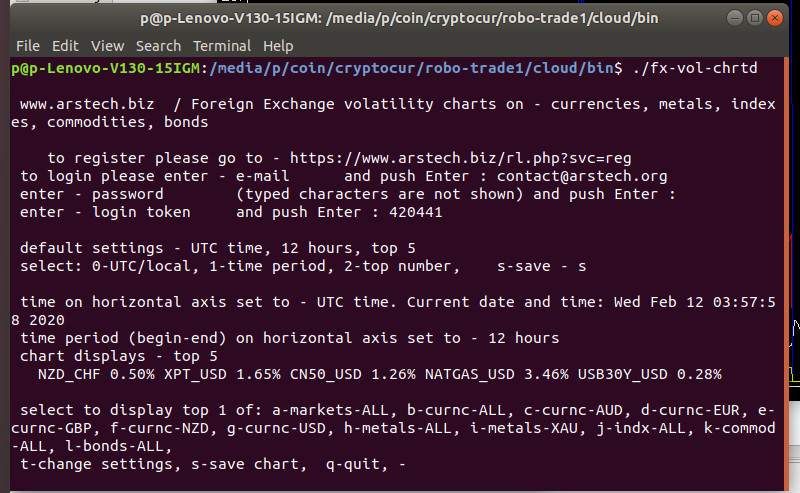
When started the program runs into 2 screens -
- text screen - allows change of view and settings
- graphical screen - shows the movement through time of the highest volatility items
While the data collection system is capable of collecting information much faster the charts are composed of data points in 1 minute intervals.
The user has the choice of:
- selecting display in UTC time or local time
- selecting the top volatile items in an individual category (for ex. top in currencies), or the top one of all categories
- selecting the top - 3, 5, or 8 items
- selecting the time period displayed - last 6, 12, 24, or 48 hours
- saving of the current chart image to an image file
The charts allow interactivity and feedback in the form of mouse actions over the chart
- temporary show of the percentage / % (on vertical axis) and time / HR:MN (horizontal axis)
- removing items (chart lines) from display one by one
- adding permanent marks on the chart with -> [number] [percentage] [time]; the [number] increases
sequentially with every new new mark and allows referencing in the image
- dragging (horizontal axis movement) - allows scrolling left/right through time
- saving the chart and the added marks as an image file
3. Price and Download
The ForEx Volatility charts have a demo (free) version and a standard (paid) version.
- the demo version uses a sample of real previous data recorded in the past. It is intended as a way of the user to get
familiar and have hands-on experience - free
- the standard version continuously downloads and displays real time data - US$49 / month
Both versions are available for download at these links:
fx-vol-chrtd - demo version
and fx-vol-chrt - standard (live) version .
Each link points to a folder containing 3 separate .zip files for each of the operating system platforms - windows, mac-os-x, linux-x64
For details on the download, install, run and use please check -
User's guide - Foreign Exchange volatility charts .
Before running the program the user has to - Register for the use.
At the registration the user puts their e-mail address , types a password, and obtains a 6 digit login token by e-mail.
The user has to submit payment information when registering of the standard (live) version.


